RCC has developed some novel techniques to visualise hydrodynamic models, working with UQ’s School of Civil Engineering.
RCC research analyst Oliver Cairncross has worked with Dr Badin Gibbes and Dr Dave Callaghan from the School to develop a flow data application—the Interactive Flow Visualiser—that makes it much easier for researchers to spot and analyse patterns.
Existing methods for visualising flow data generally rely on creating 2D cuts through the model, which may be animated to represent the time component. This is normally done by generating movies from base data.
The Interactive Flow Visualiser enables researchers to quickly move about the hydrodynamic model and scroll through time instantly without the need to generate movies. It also allows the user to map scalar values from the model (e.g. salinity, temperature, etc.) into the visualisation. Users can manipulate these values or change heat map parameters instantly in order to get a better understanding of the system’s behaviour.
Dr Gibbes says, “The ability to interactively explore model outputs in three dimensions has significantly enhanced our understanding of the interactions between hydrodynamic and water quality processes.
“In the past it was challenging to make full use of the large amounts of data generated by these types of coupled hydrodynamic and water quality models. The Interactive Flow Visualiser has, for the first time, allowed us to quickly identify features in the simulation data that are not immediately obvious when using the traditional visualisation method.
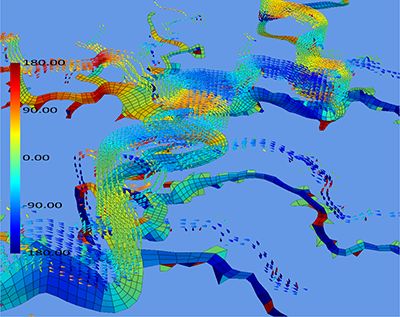
“For example, we have been able to quickly identify areas of rapidly varying flow directions as well as layered flow systems within estuary models. These hydrodynamic processes have a strong influence on water quality. These features can be challenging to identify using more traditional visualisation and analysis methods. The potential of the Interactive Flow Visualiser is quite exciting for our research.”
Dr Callaghan says the application “makes things come alive in ways we haven’t seen before. For example, we can now see hot spots in salinity, driven by secondary flows around river bends. This would be very difficult to interpret using a 2D representation, but all the dimensions are in play when using the immersive three dimension model.”
“3D visualisation has led to discoveries in model outputs that were previously missed. A big user of this application could be industry as well as researchers in trying to interpret complicated 3D big data,“ he says.
Other researcher groups have been approached to see if they would find the application useful, namely, UQ’s Centre for Hypersonics, Centre for Geoscience and the Climate Research Group.
Currently the RCC is working to incorporate geoscience, hypersonic and weather data into the Interactive Flow Visualiser. Additional features specific to these new fields of research have been implemented and, according to Oliver, early results are looking promising.


