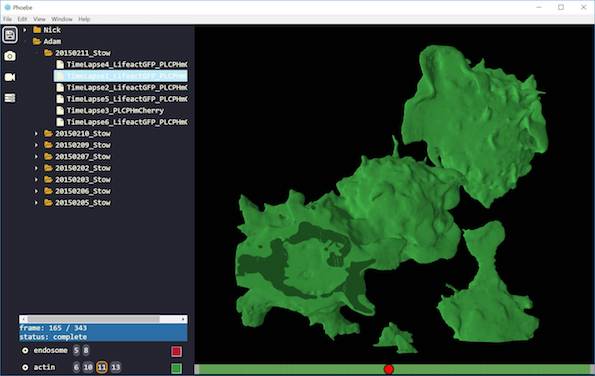
Visualisation
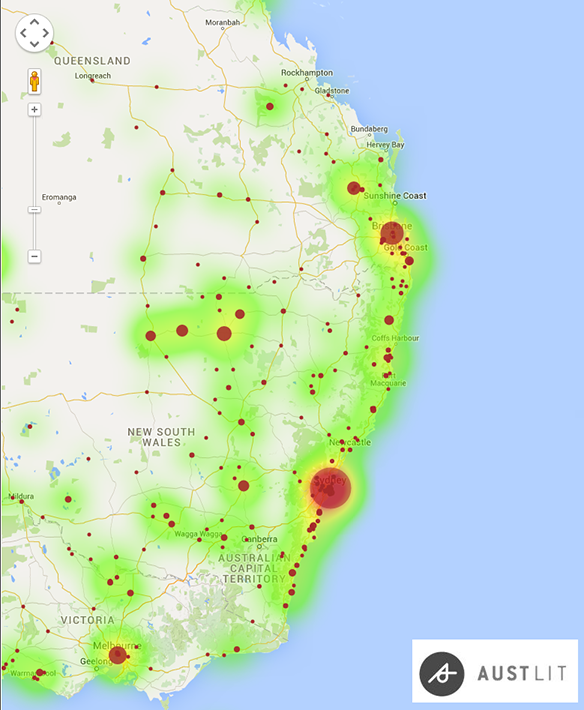
Visualisation is the graphic illustration of data and computational models, helping researchers gain insights.
As the volume of research data in the world increases, visualisation is increasingly being used to display trends or patterns in data and to communicate research information and outcomes effectively and efficiently.
The growing number of visualisation tools and services help researchers create imagery from their data by the use of graphics, colour and interactivity. Tools currently employed include:
- MATLAB
- VTK
- ParaView
- POV-Ray.
Please contact RCC’s Oliver Cairncross if you have any questions about RCC's visualisation expertise and how it can help your research: o.cairncross@uq.edu.au.