  • UQ Home
  • Contacts
  • Study
  • Maps
  • News
  • Events
  • Library
  • my.UQ
The University of Queensland

Research Computing CentreResearch Computing Centre

Site search
Homepage Site menu
  • Home
  • Core Technologies
    • High Performance Computing
    • Cloud computing
    • Workflow
      • Nimrod
      • Kepler
      • Galaxy
        • Genomics Virtual Lab
    • Data Management
    • Visualisation
  • Infrastructure
    • High Performance Computing
      • Bunya
      • Tinaroo
      • Wiener
      • RCC Active Changes (UQ only)
      • RCC Active Incidents (UQ only)
      • RCC User Guides (UQ only)
      • RCC User Guides (public)
      • External resources
      • Bunya
    • Cloud computing
    • Data storage
    • Characterisation Virtual Laboratory
  • Themes
  • Media & Events
    • News
    • Newsletters
    • Events
      • Upcoming seminars
    • RCC seminars
    • RCC presentations
    • Media mentions
  • About
    • RCC's Mission
    • Research impact
    • The RCC team
    • Governance
    • RCC Fellows
    • Student internships in the RCC
    • QURPA
      • QURPA trip report 2020—Edward Davis
      • QURPA trip report 2020—Aviral Kailash Jain
      • QURPA Trip Report 2019
      • QURPA Trip Report 2016
      • QURPA Trip Reports 2015
      • QURPA 2020: Using machine learning to detect falls
    • Acknowledging RCC
  • Contact
  • Support
    • Training
    • Meetups
    • Support Desk
    • Service Status
  • FAQS

Visualisation

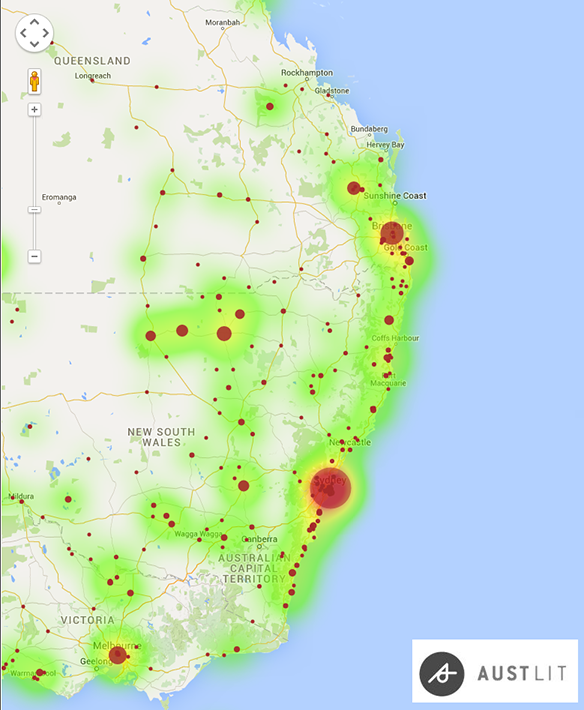
BlackWords project on AustLit.

Visualisation is the graphic illustration of data and computational models, helping researchers gain insights.

As the volume of research data in the world increases, visualisation is increasingly being used to display trends or patterns in data and to communicate research information and outcomes effectively and efficiently. 

The growing number of visualisation tools and services help researchers create imagery from their data by the use of graphics, colour and interactivity. Tools currently employed include:

  • MATLAB
  • VTK
  • ParaView
  • POV-Ray.
     

Phoebe

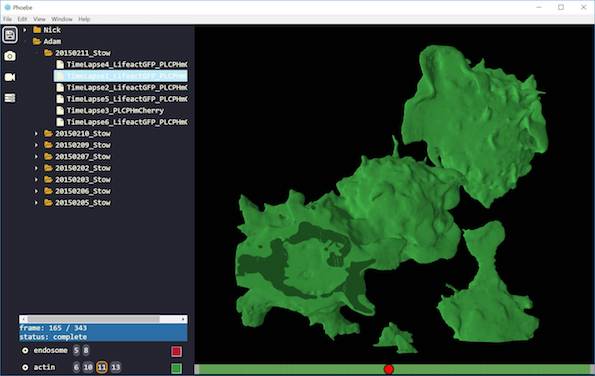
Phoebe is a RCC-developed advanced data visualisation system that allows researchers to investigate large, volumetic, time-series microscopy data sets using a 3D interactive user interface.

Phoebe provides researchers with the ability to survey and animate very large data sets in real time as if they were interactive movies.

Phoebe offloads expensive data processing and storage onto UQ’s high-performance computers to provide a seamless high-speed experience.

Researchers can fine-tune Phoebe’s output by adjusting various parameters on an ad hoc basis. Behind the scenes, the tool is constantly adjusting its computation engine to stay in synch’ with the user.

Phoebe is an open-source distributed system composed of a multiplatform user interface (Windows, Linux, Macintosh); a multi-process and multi-CPU compute engine; and a database which ties everything together.

UQ’s world-class Lattice Light Sheet Microscope (LLSM) — installed at the Institute for Molecular Bioscience (IMB) in September 2017 — motivated Phoebe’s development, but the tool is applicable to other types of imaging data.

The LLSM can generate up to 7 TBs of imaging data per day, and Phoebe helps process, organise and visualise the huge amounts of data that the LLSM generates.

Please contact RCC’s Oliver Cairncross if you have any questions about Phoebe: o.cairncross@uq.edu.au.
Phoebe
 

  • High Performance Computing
  • Cloud computing
  • Workflow
    • Nimrod
    • Kepler
    • Galaxy
      • Genomics Virtual Lab
  • Data Management
  • Visualisation
© The University of Queensland
Enquiries: +61 7 3365 1111   |   Contact directory
ABN: 63 942 912 684   |   CRICOS Provider No: 00025B
Emergency
Phone: 3365 3333
Privacy & Terms of use   |   Feedback   |   Updated: 26 Apr 2018
Login