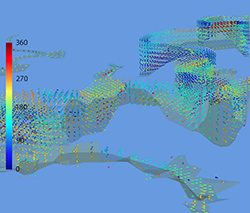
 RCC’s visualisation expert is developing an application that makes it much easier for researchers to spot and analyse patterns in flow data.
Flow data can involve anything that moves, such as water, wind, force and energy, etc.
Oliver Cairncross says the yet-to-be-named app allows researchers to view and interact with very large, animated vector datasets in real time.
“Not only can we visualise the flow but we can also see how the flow impacts other variables and vice versa. We do this by mapping colours that represent other variables into the scene and we can look at the interplay over time,” says Oliver.
“Allowing this to be done quickly is what makes the visualisation interactive. A user can change the view, variables and time simply by clicking and dragging with a mouse. Adopting techniques used in modern computer games has helped make this possible.”
Oliver is adding the final touches to the app and will then hand it over to second-year UQ engineering students to see if the students can pick up behaviour in the data model that isn’t apparent when using traditional visualisation techniques.


